The Problem
Multiple teams. Zero shared source of truth. Design debt compounding daily.
GE Renewable Energy had multiple teams designing and building across different platforms, Digital Wind Farm, MTM Mobile, and more, but no unified design language connecting any of it. Designers duplicated work constantly. Developers recreated the same components with slight variations across codebases. Even basic decisions like button styles, font weights, and icon usage differed wildly depending on which team you talked to.
This isn't typical intern territory. But the problem was real, the need was urgent, and nobody had tackled it yet. My goal over 12 weeks was to research, scope, and ship the GE REDS Design System, a centralized source of truth for design and engineering teams across the organization. What started as a visual library became something much more involved: a three-phase build that required working across design, front-end, and back-end engineering to get components all the way from pixel to production.
Discovery & Research
Before building anything, I needed to understand what we actually had.
I started by auditing the existing Sketch libraries, reviewing every page, modal, menu, and interaction element across current products. What I found confirmed the problem: dozens of inconsistent button styles, misused font weights, one-off icons with no documentation, and redundant naming conventions that meant the same thing in different ways depending on which team created them.
Beyond the audit, I went hands-on with the actual product UI. I annotated existing components with pointed questions and brought those annotations into conversations with dev and product teams. This wasn't just about finding inconsistencies. It was about forcing alignment on decisions that had never been explicitly made.
How can we centralize design at GE Renewables to make design faster without sacrificing consistency?
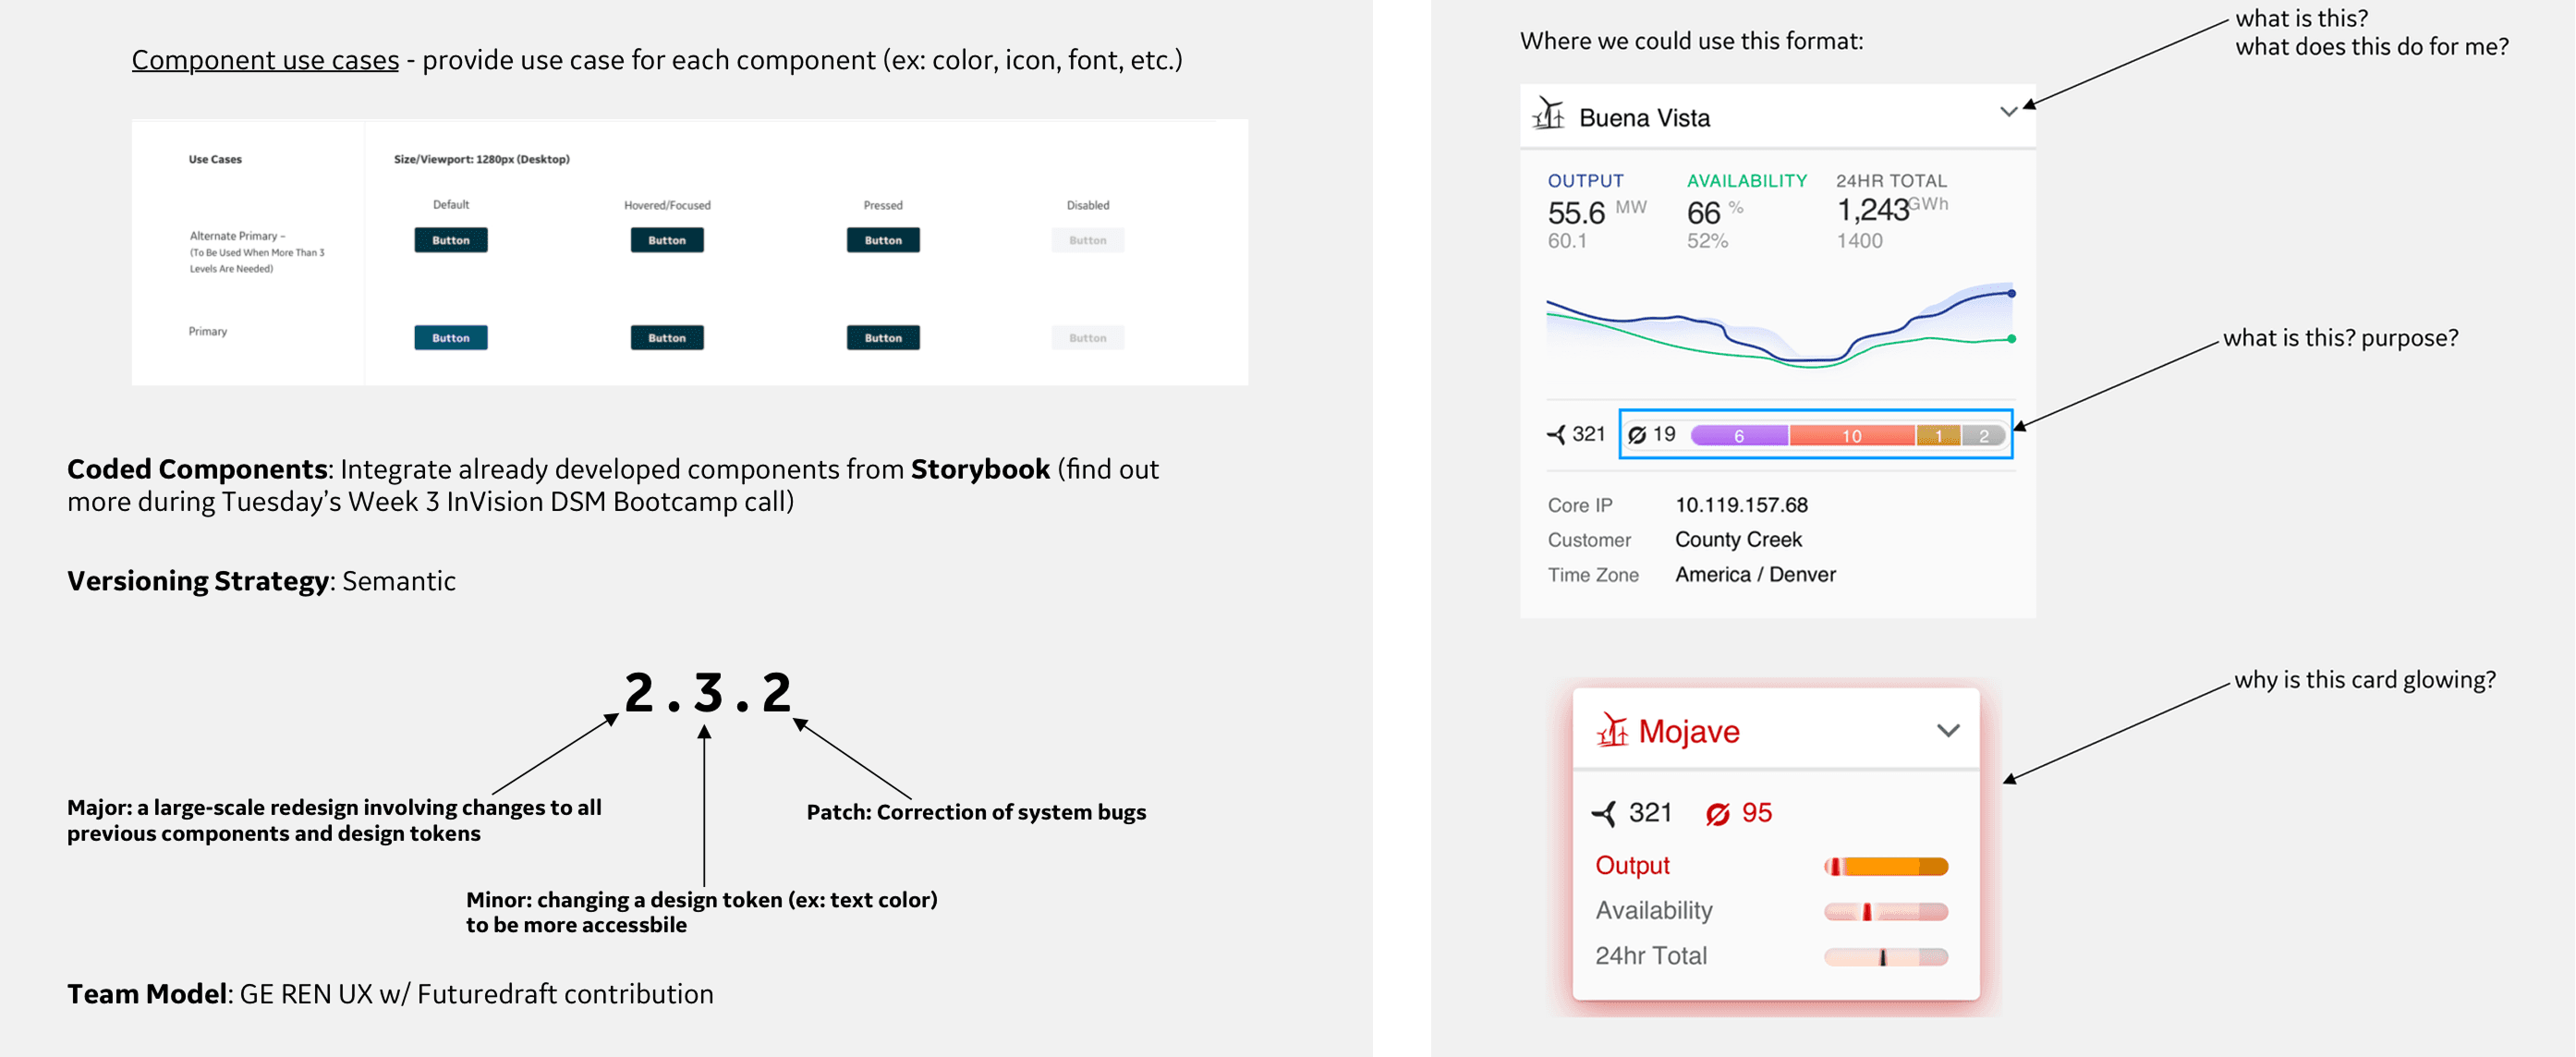
Annotated UI components from existing GE products, surfacing questions about purpose, behavior, and visual logic that had never been formally documented. These became the foundation for cross-team alignment conversations.
Key Insights
Three root causes behind the inconsistency.
No shared language
Teams were making the same design decisions independently, with no mechanism to share outcomes. The same component could exist in three forms across three codebases with no single version considered canonical.
Undocumented decisions
Most UI components had no rationale attached to them. Nobody could answer why a pattern worked the way it did, which made it impossible to build on consistently or hand off clearly to engineering.
No tool for sharing at scale
Even if teams wanted to reuse each other's work, there was no platform to make that practical. Sketch libraries were siloed, versioning was manual, and there was no approval or contribution process in place.
Platform Selection
I didn't just pick a tool. I built the case for it.
Choosing the right platform was a real decision with real stakes. The wrong tool would create adoption friction, slow down engineering handoff, or get blocked by GE's approval process entirely. I evaluated four candidates: InVision DSM, Knapsack, Zeroheight, and Storybook, across criteria that mattered to our actual situation. Sketch integration with live sync, the ability to document both design and code in one place, approval-free collaboration for a cross-functional team, and GE corporate approval status.
InVision DSM was the only platform that checked all four. It offered real-time Sketch sync, combined design and code documentation, easy collaboration without gated approval flows, and was already cleared by GE's internal security and procurement process. I presented this analysis directly to stakeholders before a single component was built, which meant the platform decision had full buy-in before we committed to it.
| Criteria | SelectedInVision | Knapsack | Zeroheight | Storybook |
|---|---|---|---|---|
| Sketch support w/ sync | ||||
| Design + Code documentation | ||||
| Easy, approval-free collaboration | ||||
| Approved by GE |
Scoping the MVP
50+ components. One intern. Twelve weeks. I needed a plan.
Before building, I scoped the full MVP component list across atoms, molecules, organisms, templates, and pages, covering everything from color tokens and typography to data visualization charts, modals, and full page layouts for both Desktop and Mobile. This wasn't a wishlist. It was a prioritized roadmap used to align engineering and product on what was shipping in the initial release and what came after.
I also defined the versioning strategy upfront: semantic versioning (Major.Minor.Patch) so teams knew exactly what a version bump meant and when to expect breaking changes. Major for large-scale redesigns touching all tokens, Minor for targeted token changes, Patch for bug corrections. This gave the system product-level maturity from day one.
Atoms
8Colors, Text styles, Layer styles, Icons, Glyphs, Alerts, Badges, Status
Molecules
19Buttons, Form field, Data viz mini, Bar chart data, Text field, Text field w/ icon, Dropdown, Date fields, Checkbox, Dropdown picker, Date picker, Collapsible panel, KPI, Loader, Hover menu, Modal, Radio, Select, Tooltip
Organisms
16Page headers, Panel headers, Asset group indicator, Content modules, Data viz card, Data viz KPI, Full form error, Data viz chart, Grids, Grids status, Cards, Filters, Hover cards, Tables, Scrolling container, Lists
Templates
4Navigation, Navigation menus, Object panels, Tabs
Pages
4Filter pages, Login page, GE VD layouts, Map view
- 50+
- Total components
- Desktop + Mobile
- Platforms
- Mid-October
- Release
Information Architecture
A system nobody can navigate is a system nobody uses.
Once the component list was scoped, I built a full information architecture for the system, mapping every section, subsection, and component across Desktop and Mobile platforms. Rather than defaulting to strict atomic methodology, I organized by usage and visual similarity. In an enterprise environment with dozens of contributors and varying design maturity levels, intuitive hierarchy mattered more than methodological purity.
The IA covered Style Guide, Iconography, Templates, Navigation, and Components for Desktop with a parallel structure for Mobile. Every section was mapped before any component was built in DSM, which meant the team always knew where things lived and how the system would grow.
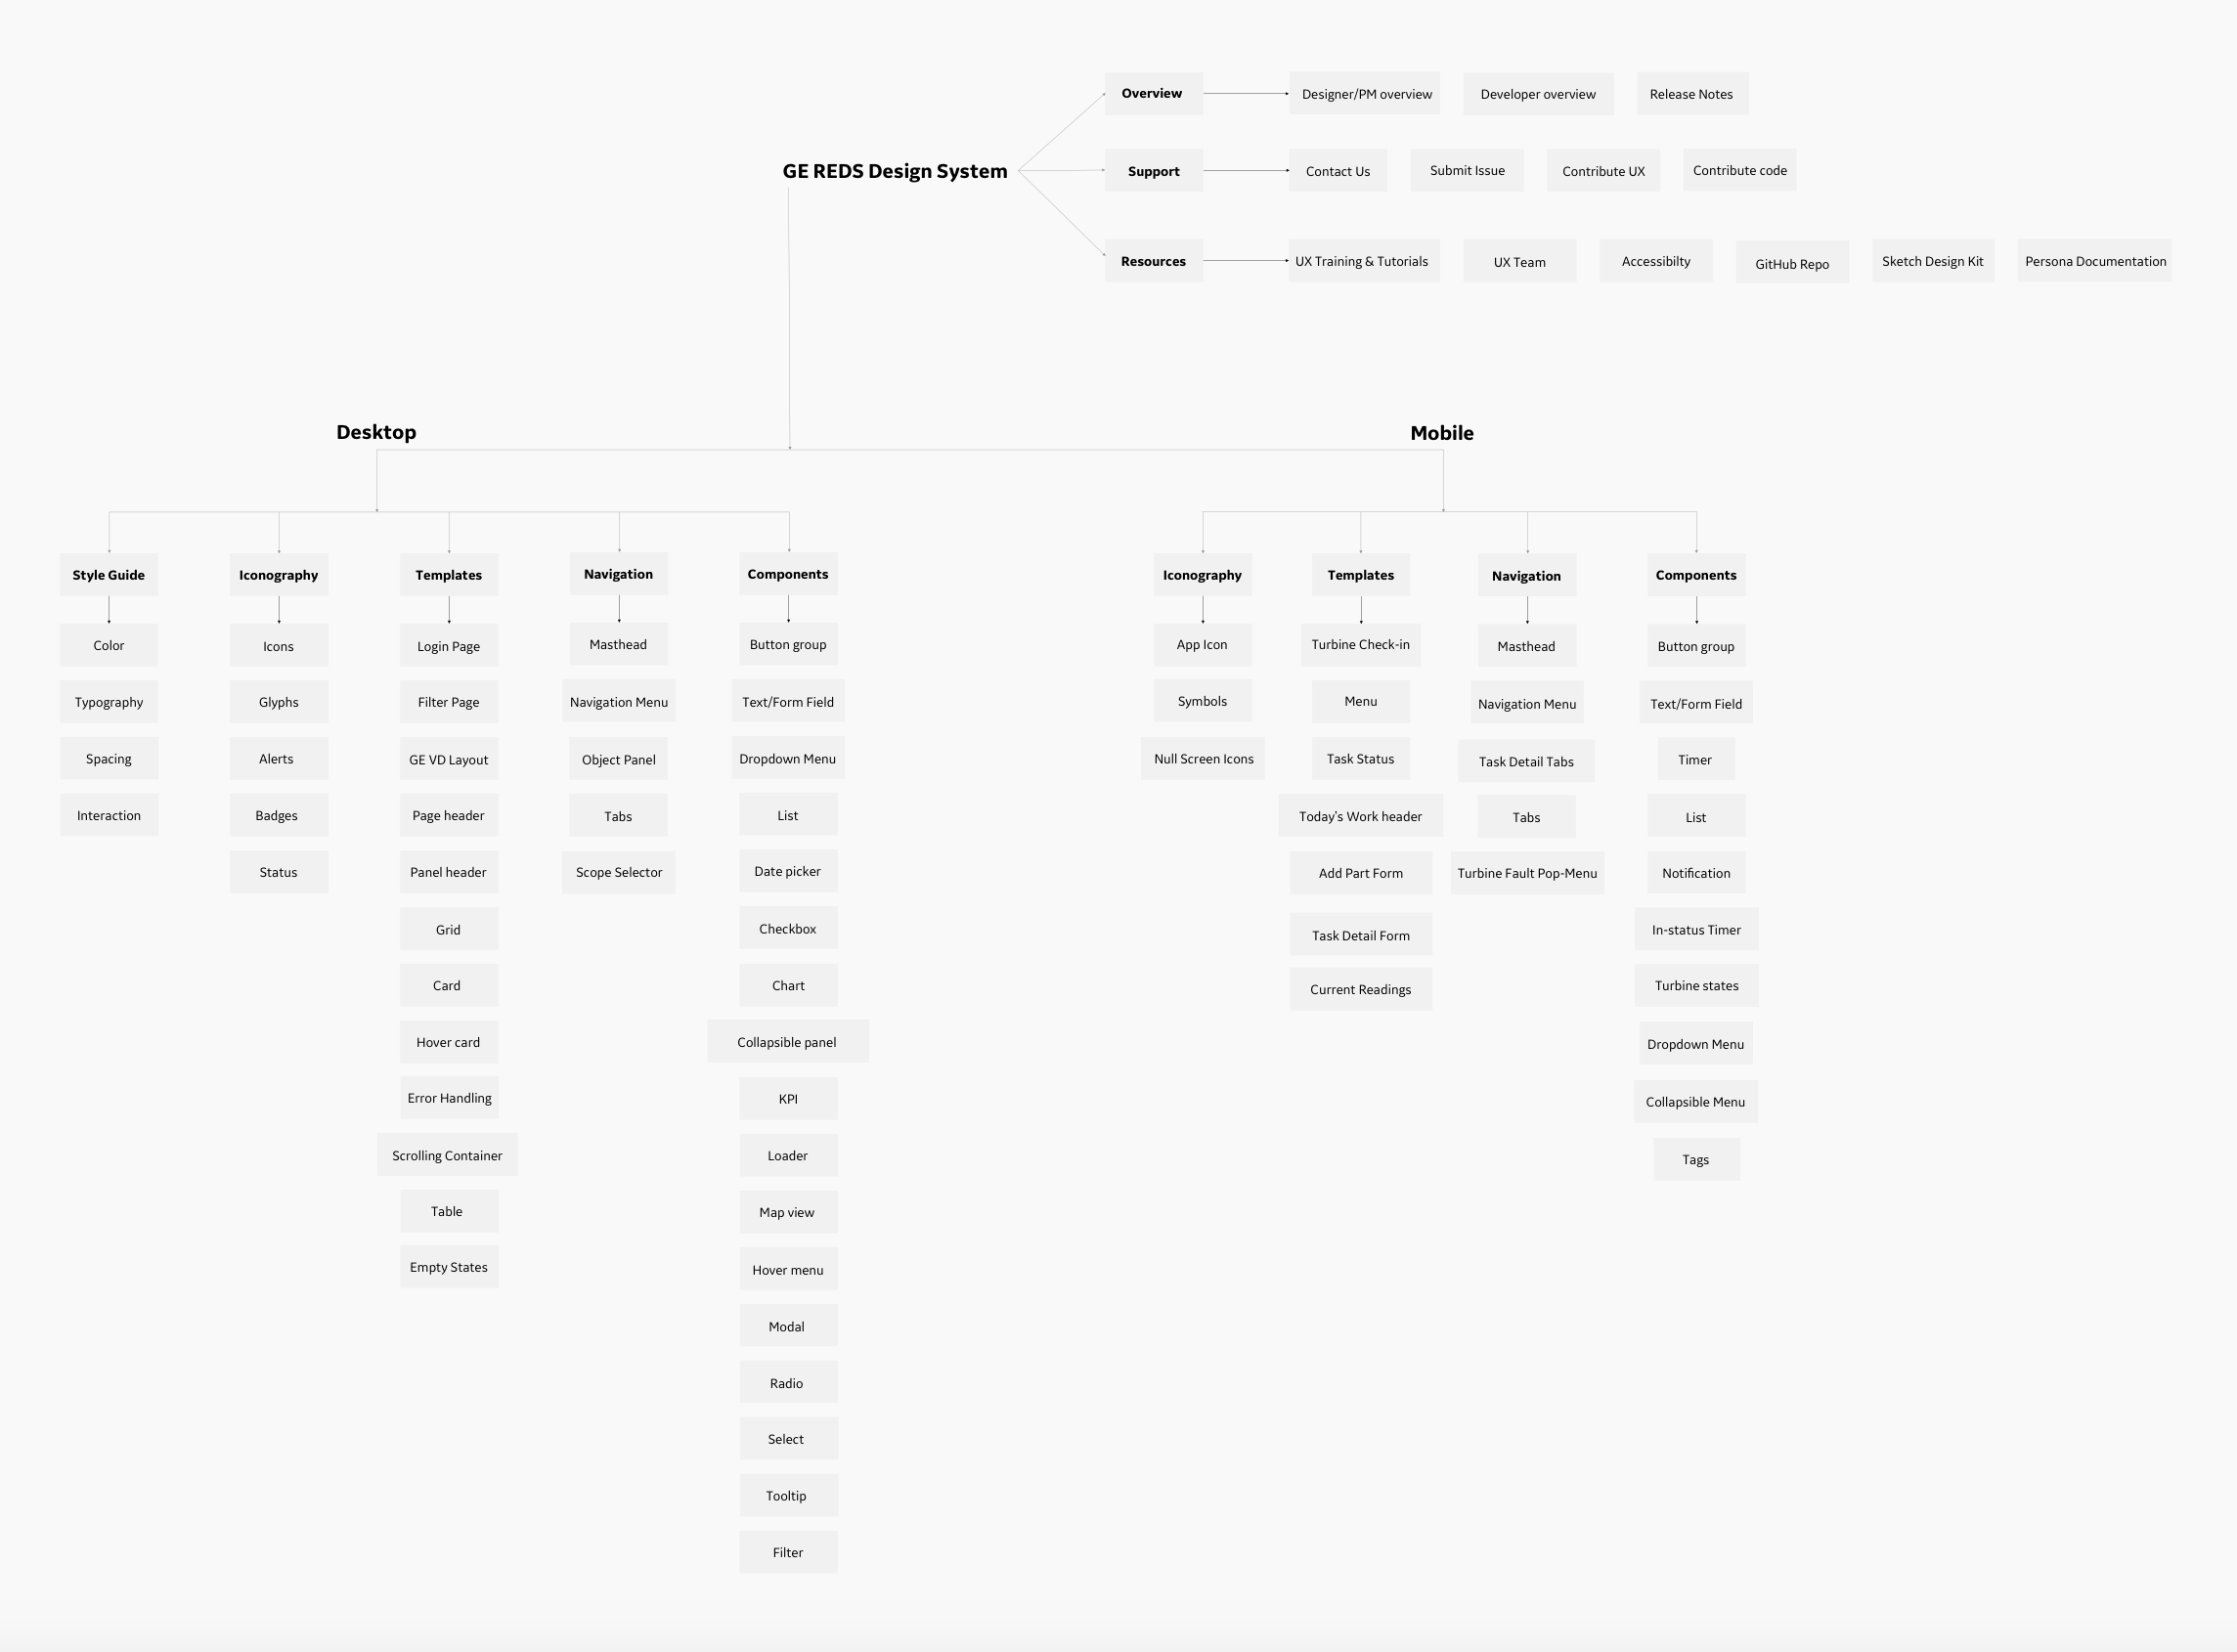
The full information architecture for the GE REDS Design System, covering Desktop and Mobile across Style Guide, Iconography, Templates, Navigation, and Components.
Design Iteration
What started as a visual library became a full engineering integration.
The build didn't unfold in a straight line. Each phase surfaced requirements the previous phase hadn't anticipated, pulling in different types of engineers at every stage. What I thought was a design project became a cross-functional product, and the system is stronger for it.
Three phases. Each one revealed something the previous phase couldn't anticipate.
Process artifacts recreated from memory for portfolio purposes. Original Figma and InVision DSM files under NDA.
- 01
Visual designs only
FoundationDesignFront-endBack-endThe first phase focused entirely on translating the Sketch audit into clean, documented visual components. Buttons, cards, dropdowns, modals, every component designed to a single canonical standard and published to InVision DSM.
“The designs look great but engineering can't use them without understanding the states, variants, and edge cases. We need more than visuals.”
- 02
Pairing code with every component
Escalated scopeDesignFront-endBack-endEach visual component was matched with its corresponding code implementation, HTML, CSS, and state documentation. This required working closely with front-end engineers to understand how components would actually be built, not just how they looked.
“The code snippets are helpful but some of our components talk to back-end data models. We need to map these to existing APIs before teams can fully adopt.”
- 03
Integrating with existing APIs and touchpoints
ShippedDesignFront-endBack-endThe final phase required connecting the design system components to GE's existing data models and product touchpoints, Digital Wind Farm, MTM Mobile, and shared dashboard infrastructure. This meant coordinating with both front-end and back-end engineers simultaneously and understanding data structure constraints that had never been surfaced in the design process before.
“Everything finally connects. The components pull from the right data sources and the patterns hold across both products. This is what a real system looks like.”
Implementation
Three calls that shaped how the system actually got built.
Usage-first IA over atomic methodology
Atomic design is elegant in theory, but in a large enterprise with varying levels of design literacy, asking engineers to search for 'molecules' creates friction. I organized the system by how people actually think about components, by purpose and context, which drove faster adoption and fewer 'where do I find this?' questions.
Engineering alignment before handoff, not after
I sat in on engineering sprint meetings to understand how the device data was structured, what constraints existed around component state, and what the dev team actually needed from documentation. This meant component specs included real use cases, edge case handling, and code snippets, not just visual references. The result was a 40% drop in design-related support tickets post-launch.
The system as a product, not a deliverable
Most intern projects get handed off and forgotten. I treated REDS like a living product, with version notes, a contribution model, weekly update communications, and feedback sessions with developers to identify friction. I presented the system to design, product, and engineering leadership and positioned it as something that required ongoing ownership, not a one-time build.